
Google Chrome’s DevTools console is a powerful tool that can identify errors and help find a speedy solution to technical issues. It's also easy to use.
What is the DevTools Console?
The DevTools Console in Google Chrome will show critical errors and other important messages generated when viewing a web page. These errors can give technical support teams a clearer idea of why something isn't working as expected, and speed up the process of troubleshooting and problem solving.
How to open the DevTools Console in Chrome
You can use it to quickly and easily provide our technical support team with this data by saving a LOG file of the feedback in the console.
There are three ways to open the Developer Tools in Chrome:
- On Windows or Linux, press CTRL + SHIFT + J. On a Mac, press Command + Option + J. This is the quickest way to get to the console.
- Right click on the page and select Inspect, then click the Console tab.
- Select Chrome Menu > More Tools > Developer Tools, then click the Console tab.
Using the DevTools Console to find errors and save it to a LOG file
Once you've opened the console, reload the page which is causing the error or otherwise not working as expected. Information should appear in the console, like this: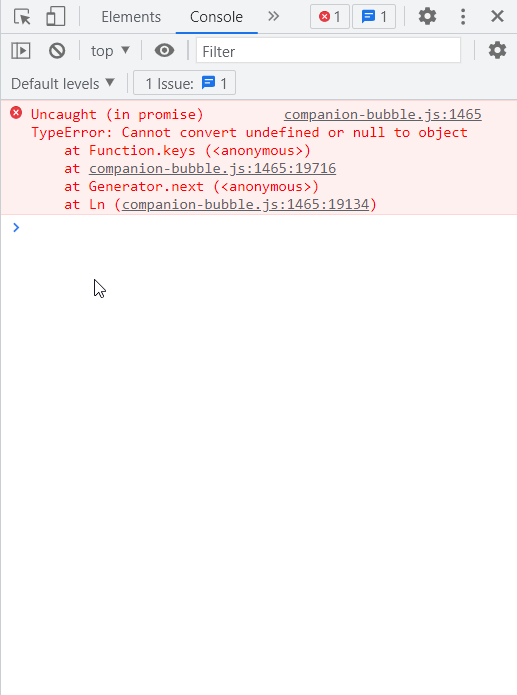
You can then right click in the console and select Save As. Save the file as a LOG file (likely the default), then send the file to our support team so we can investigate any errors or other responses from the web page.
Video Walkthrough: